The total market capitalization of all NSE-listed firms hit $4 trillion or over Rs 334.7 lakh crore, climbing over $600 billion since the start of the year. Meanwhile, the NSE-listed firms achieved a $ 4 trillion m-cap milestone from $ 3 trillion in just 30 months. Apart from the NSE-listed companies’ market cap, here are other details:
Agencies
2/8
Global Markets
Among global markets, the Indian stock market is ranked fifth in terms of market value, behind the US, China, Japan and Hong Kong.
Agencies
3/8
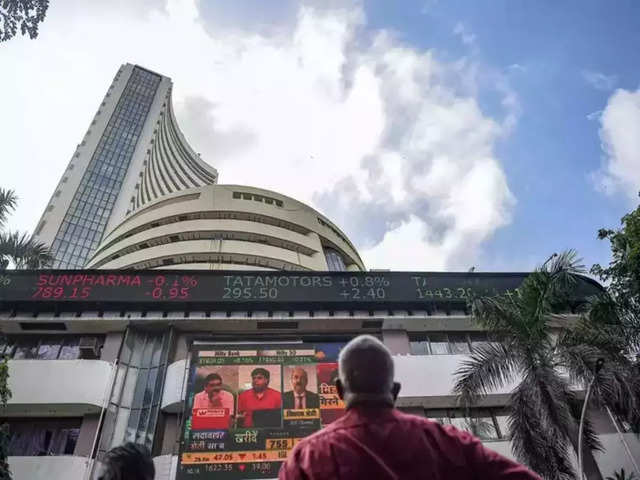
Journey of $4 trillion market cap
The journey of market capitalization of Indian listed companies from $2 trillion (July 2017) to $3 trillion (May 2021) took about 46 months whereas the last $1 trillion i.e., from $3 trillion to $4 trillion took only about 30 months.
IANS
4/8
Rs 5 lakh crores mobilized through primary markets
In the current financial year as of October 2023, more than Rs 5,00,000 crores have been mobilized through primary markets across equity and corporate bonds.
Agencies
5/8
Market cap growth rate
The market capitalization of listed companies increased at a compounded annual growth rate (CAGR) of 17.5% in the last 10 years. The Nifty 50 index delivered 14% CAGR in the last 10 years and 14.9% in the last 20 years.
Getty Images
6/8
Top 3 firms M-cap
The top 3 companies by market capitalization – Reliance Industries Limited, Tata Consultancy Services Limited and HDFC Bank Limited remained the same when the market capitalization hit the $2 trillion, $3 trillion, and $4 trillion mark.
ANI
7/8
Top 5 nations based on market capitalization
While India ranks amongst the top 5 nations based on market capitalization, the market capitalization of listed companies on NSE to India’s GDP stood at 1.18 or 118% which is lower as compared to developed markets such as the United States of America or Japan.
Agencies
8/8
Daily average turnover
The daily average turnover has seen a year-on-year growth of 27% in the equity segment and 5% in equity derivatives in this financial year as compared to the previous financial year. In the last 10 years, the equity segment’s daily average turnover has increased by over 6 times and that of equity derivatives’ daily average turnover has increased by over 5 times.